Showing posts with label Alarm. Show all posts

Friday, March 7, 2014

Real Time Congestion Monitoring on Arterials

This article is on how to use your central system to provide real time congestion mapping, and incident notifications.  The example here is using Naztec's ATMS.now central system and Naztec controllers using Apogee Version 76.x firmware.  As I have said before, I am not a Naztec employee, or vendor.  I am a local agency traffic engineer who uses Naztec products.  I would assume that other brands of controllers and central systems can do similar operations.

In our case, each detection zone (each induction loop (or array of circle loops within a specific lane), video detection zone or radar detection zone is brought back into the controller using a unique channel.  The desire for detailed operational information drove the specific design of signal cabinets and detection systems.  We have a Caltrans 332 style cabinet which has a modified I and J file and wiring harnesses to take advantage of 46 unique detection inputs into the 2070 controller using the C1 and C11 harness.  The vast majority of our signal cabinets are NEMA TS2-1 where we have up to 48 or 64 channels of detection coming into the controller.  While this may seem excessive, the rich data we are provided through this expanded detection methodology provides us with a lot of tools to help our signals run better, and provide additional data for determining performance.

Each detection input is monitored in the controller for detection diagnostics along with logging volumes and occupancies on 5-minute intervals.  Almost all stopbar detection occupancies are tied to only log the occupancy when the signal is either green or yellow for the associated phase the detection channel drives in the controller.  In some cases, we choose to log green + yellow + red, or only yellow + red, but the vast majority of the stopbar detectors are logging occupancies only during green plus yellow.

In some cases, we do also mirror specific detectors to log green + yellow under one channel, but mirror the detection to log green + yellow + red, if we need additional information about how the lane is operating.

Why do we do this?

There are a lot of reasons.  One primary reason is that the central system is programmed to monitor each group of lanes for congestion.  The left turn lanes are separately monitored from the thru lanes.  When congestion occurs, the system logs the congestion levels, and specifically shows them on a map.  When specific thresholds are exceeded, the system also sends email notifications about a specific left turn or thru movement which has excessive congestion.

How do we do this?

As stated before, each controller's detection inputs are logging congestion data on 5-minute intervals.  That information is uploaded every 5 minutes to the central system via the Ethernet communications.  This is done mostly via fiber optic interconnect or Ethernet radios.  At some remote signals, the communications are accomplished via 3G cellular data modems.  We have had up to 4 signals reporting back continuously via cellular data modems without any problems.

ATMS.now – Congestion Monitoring Configuration

The basic congestion mapping for North, South, East and West is mapped on the scan screen, however functions within ATMS.now allow for additional information to be used for incident triggering.
Below is a picture of NE Hazel Dell at Ne 99th St, showing the detector layout and the basic N, S, E and W congestion mapping.

Screen shot of Naztec ATMS.now central system showing the detection, phasing, pedestrian
and other features.  The green lines with "Occupancy: #" show the percent occupancy during
the approach's phase green + yellow of the stopbar detection for the previous 5 minutes
Each detector used for this function needs to have occupancy, or volume checked in the controller (MM-5-2, Occup and Volum columns).  The reporting period of the detector data needs to be set to 5 minutes in the controller (MM-5-8-1).

Each of the directions need to be associated with the specific detection inputs for the congestion levels.  In addition to the north, south, east, and west congestion levels being defined, the other 4 are defined.

Screen shot of Naztec ATMS.now central system definition of congestion mapping for a
signalized intersection The user has the option of choosing congestion thresholds of
occupancy, volumes or speeds based on specific detection inputs.  The specific
threshold values for "Medium" and "High" correspond to the color of the lines
on the map for the congestion (low is green, medium is yellow and high is red).  The
specific medium and high thresholds also correspond to unique incident triggers
 that the central system can implement.
Under Definitions, Incident Triggers, create the incident triggers for the 8 locations.

Screen shot of Naztec AMS.now showing the incident triggers based on inputs
Note that there are 8 separate congestion alerts for each signal (1 for each left turn, and 1 for each thru movement).  This is true only where separate left turn lanes exist.  In the event that the left is permissive, this tracks the frequency that congestion on the permissive left turn lane exceeds the high threshold as set in the Congestion Level Definition.

One problem with this system is that when a loop fails, and constantly calls, this mapping will generate constant email messages.  If you look at the list above, under 3425, you will see that none of the day of the week boxes are checked (orange oval).  In this case, a contractor cut out the stopbar loops when they were not supposed to, and the controller is running in recall, with the loop amplifiers failing.  To keep the email messages from overwhelming the user, this approach’s two congestion incident triggers were turned off for weekdays.  This provides a good visual indication of where problems need to be fixed in the field.

Under Incident Trigger, create the congestion incident triggers similar to the following.  The text for the box “Description” is important, since this is the specific message provided in the email, and in reports run in ATMS.now.

Screen shot of Naztec ATMS.now incident trigger.  The specific time and dates when the incident
trigger is in place can be customized.  The incident triggers can also be set up based on
alarms or congestion to change the pattern, turn on a CMS sign with a message, turn on a video
camera which has been integrated into the central system software using the IV&C video relay
software, or send out an email notification
In general, the congestion incident triggers only run from 5 AM to 8:59 PM, Monday through Friday.

In the future, additional information will be included, such as camera triggers, to allow for future implementation of automatic PTZ camera viewing of congested areas.

The orientations on the incident trigger congestion and congestion level definition are as follows:

NB - North NBL – North West
SB – South SBL – South East
EB – East         EBL – North East
WB - West WBL – South West

The user distribution is set to Clark TMC Staff

Screen shot of Naztec ATMS.now central system showing how to set up the email alerts to a
specific group of users based on the incident trigger.
When the incident trigger criteria is met, ATMS.now will send an email to the people listed on the Clark TMC staff for the specific approach with the congestion alert.

The email sent will look similar to the following.  Note that the message in the text of the email is what was entered in the “Description” box of the incident trigger definition, plus the date and time.

If you do not populate the “Description” box with enough information, the emails will not have any specific meaning. 

Sample email from central system showing congestion incident
Specific reports can also be run within ATMS.now

Sample report from Naztec ATMS.now showing the reporting abilities

Like other reports in ATMS.now, the text of the report can be exported to Excel, PDF, Word documents and RTF formats, in addition to printing them out on a printer.

Additionally, specific reports can be run showing the relative congestion on specific approaches to the signalized intersections.

Sample of congestion reporting for sample intersection.  The different colored lines
correspond to the  specific occupancies of the stopbar detectors during
green plus + yellow of the signal for that approach's phase.

Conclusion

This is a lot of work to do.  There are dozens, if not hundreds of settings in each controller.  There are thousands of settings in the central system which must be made, and verified.  A detailed understanding of how each controller is connected to the unique detection system in the intersection is mandatory.  After the system is set up, all of the thresholds will need to be verified and adjusted to show what is truly special as opposed to regular congestion.

The net result is that this type of operation in a central system provides invaluable data for understanding where the problems exist regularly as opposed to occasionally.  Also, this type of approach to signal operations provides advance notice that something is happening in the field.  In many cases, the system has told me that something has occured (collision, failed detection etc) via this type of programming, and I am already working on the fix, or in many cases have already addressed the issue before the phone calls come in.

Monday, August 20, 2012

A couple more thoughts about detection diagnostics

This is a continuation of the earlier post on detection diagnostics, at:

http://ntcip-unleashed.blogspot.com/2012/02/controller-detection-diagnostics.html

The detector settings need to be reviewed to make sure that the global settings are not creating undue consequences.

In one recent example, a left turn pocket had moderately high traffic volumes, and the stopbar detector was a 60-ft long quadrapole.  The length of the quadrapole created a situation where there was never a gap in the traffic, so the standard stopbar (standing queue expected) timing of 5 minutes max time / 10 seconds detector fail time, created a situation where the timer for the left turn signal gapped out cycle after cycle.

This was not a new signal, but one where the operation had been changed from one brand of signal to another brand of signal as a part of a systemwide upgrade.  The settings were consistent with the previous brand's operation, but some changes were made in the conversion.

In looking at the new operation, it appeared that the signal was gapping out consistently, but there was a static queue forming.  The signal was gapping out because the detector fail mode was only placing a call for 10 seconds, and if the traffic was over the advanced detector, then the siganl would extend for time beyond the 10 seconds.

After observing the operation for a short while, it was apparent that the signal was not getting enough time for the movement.  Determing the reason for this operation was complicated by the fact that the 60-ft quadrapole also had NTCIP Queue mode turned on.

The detector diagnostics operate on the raw feed of the detector into the controller, not on the processed controller operations of the detector.

After observing the left turn pocket's operation via video feed, some modifications were made to the detector diagnostics from 5 minutes max time / 10 seconds detector fail time, to 15 minutes max time / 20 seconds fail time.

Once the timing changes were made, the left turn pocket cleared out in a few cycles, and began operating as expected.

The moral of the story is that the signal operation needs to be monitored after changes are made.

Friday, August 10, 2012

Why Communicate To Your Signals.


This may seem obvious.  But what needs to be communicated with?  What is appropriate to spend the extra money to purchase the optional Ethernet port on?  When two products are available that meet the specification, and one has data logging capabilities (and costs more), is it worth getting the device with the data logging?

Controller Communications

This is the most obvious one to connect.  Connecting the controller allows for remote uploading and downloading of the controller database, plus monitoring of the controller’s current operation.  If the signal system includes a central system, then the signal can be configured to provide data on scheduled intervals back to the central system.

The data fed to the central system can include alarms, traffic counts, current status of the controller (what phases are green, yellow, red etc.) and other information.  In some cases, the central system can be set up to log this data.  The central system that I use logs a great deal of information.  

One key piece of information that is logged, is the time served for each split division.  This is done whether the signal is in coordination, or free.  This is logged as historical information, so it is easy to run a report to look at what was happening recently for the amount of time served for any or all movements at the signal.  This can be helpful to determine what a reasonable cycle time may be for a signal.  It can also be helpful in determining if there is a problem with a signal.  Citizens will call and make statements about long waits for a green, or that a green was never served for a side street.  I have had phone calls where a citizen stated that they waited 25 minutes for a green.  There may be some truth to that statement, but having the ability to look back on the split division logs allows me to confirm that there was, or was not a problem at the specific time that the citizen stated that they had the undue wait.

The logging of data also helps identify problems with the signal operation.  If a controller develops internal problems, that information may be part of the alarm stream that is reported back to the signal.  We recently had a controller develop a problem with the TS2 communications and the controller started showing thousands of SDLC detector failures an hour.  Since the detector failures are not a critical SDLC problem for the controller, the signal kept chugging along.  A quick review of the alarm logs showed that there was a problem with the signal.  The problem was manifesting itself by causing the signal to extend, and serve movements that had no cars.  Based on the field review of the equipment, it was determined that there was a problem with the controller, and the controller was swapped out.  The BIU’s were swapped out, and the problem continued.  The problem could have been the CPU or the SDLC communications on the 2070-2N connector.  Bench testing will help determine that.  But having the controller connected to the central system gave us the first piece of information that there was a problem.

Another key piece of information is when a signal goes into all-red flash.  When a signal goes into red flash, the central system knows this within a second or two, and within another few seconds the central system sends out an email to key personnel stating that the signal is in red flash.  In some cases, I have seen signals in red flash for several days before a citizen calls in the problem.

Monitor Communications

There is a new generation of monitors generally called smart monitors.  These include advanced features for data logging, communications ports, and special programming to accommodate things like flashing yellow arrow configurations.  Many agencies are still holding on to their old monitors.  The old monitors work, but may not provide the same level of information that the more modern monitors provide.

I have had citizen calls where the citizen states that they are waiting at an intersection, and they are never getting a green.  By checking on the central system, I can see what the system states the controller is telling the system.  By checking remotely on the monitor software, I can confirm that the field indications are consistent with the central system.  

The monitor software allows for remote viewing of the signal inputs and outputs, along with the line voltages.  The picture below shows the Reno AE software talking to a Reno 1600Ge MMU.  This is a static picture, so you can’t get a real feel for the information.  The line voltages are dynamically being updated.  The current greens, yellows and reds are showing up on the screen.

Reno A&E PC software view of monitor operation

Another feature of the monitor software is that when a signal goes into flash, the monitor software can provide very good information about why the signal is in flash.  Is the problem a controller issue, a cabinet issue – that requires somebody to replace a component in the signal cabinet, or a problem with an indication that requires a bucket truck?

Problem Controllers

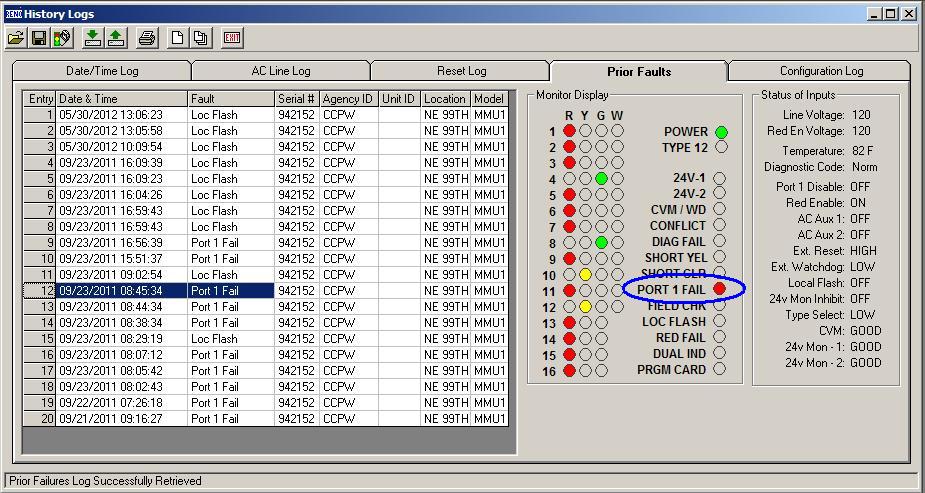
In the example below, the prior faults log is shown for a Reno 1600Ge MMU.  In this example, the controller CPU was dying. 


Reno MMU reporting a Port 1 failure
A little explanation of the standards is probably in order here.  The NEMA TS2 standards require that if a controller exhibits a Port 1 failure 3 or more times in a 24-hour period, that the monitor latch the signal in all-red flash.  The Port 1 is the main port out of the controller that provides the SDLC communications.  The controller sends out command frames, and gets response frames from the peripheral devices.  This is a very important communications node.  A Port 1 fail would typically be a failure of specific command frames from the controller.  These frames are generally routed around the controller, Terminals and Facilities (T&F, also known as the load bay) BIU’s and the MMU.  When a Port 1 failure occurs, the monitor puts the signal in flash.  If the Port 1 failure clears, the monitor will allow the controller to automatically come out of flash.  If 3 port 1 failures occur in a 24-hour period (also called in some controllers as 3 critical SDLC failures in 24 hours), then the monitor will transition the signal into all-red flash and keep it there until a technician comes by and services the cabinet.

Because the TS2 standard requires that 3 3 port 1 failures in 24 hours occur before the monitor locks the system in all-red flash, you can have a situation where the signal will transition in, and out of flash on its own.  This is not like a CVM fault, or 24V fault, where you can put in jumpers on the MMU board to latch a CVM or 24V fault.  This is a programming issue in the monitor.  To deal with this, many controller software packages allow the user to modify this by having the controller internally latch the signal in red flash when 1, 2 or 3 (user specified) Port 1 failures occur in a 24 hour period.  This will allow the controller to keep track of its own problems, and upon seeing a Port 1 failure, keep the signal in red flash.  This should allow the controller to not bounce in and out of red flash multiple times before going into locked red flash.

In the example above, the controller’s CPU was not working properly.  The controller would lock up, and create a Port 1 fail which the monitor reacted to, then the controller CPU would restart itself, then lock up, creating another Port 1 fail, restart and create another Port 1 fail, at which time the MMU would latch the red flash.

In the attached example, you can see that the controller went into red flash 3 times 8:38 AM and 8:45 AM, then a technician cleared the controller failures, restarted the controller, and the signal worked normally until it went into 2 Port 1 failures (in and out of red flash 2 times) between 3:51 PM and 4:56 PM.  This looks odd, because it looks like it went into red flash twice before it locked this time.  The reality is that I had a replacement CPU in my hand, and had just opened up the cabinet door at 4:56 PM, and the signal went through its restart procedure.  I then placed the signal into cabinet red flash, replaced the CPU, and restarted the signal with the new CPU.

Determining Conflicts

Another example of how the monitor software can help determine what is going on is when a conflict occurs.  In the example below, phases 2 and 6 were green, and the monitor showed that phases 3 and 4 showed green and reds on simultaneously.  This may not be the best example to show, but this was a case where one of the field technicians was working inside a cabinet, and momentarily contacted the greens for phase 3 and 4 to ground, which caused the signal to go into flash.

Reno MMU reporting a conflict
 While this may not be the best example, it does show information.  I got the email from the central system that the signal was in flash, and then almost immediately out of flash.  I pulled up the monitor PC software, and looked at what the monitor said it was doing.  By the time I got the monitor PC software running, the signal was out of flash.  I called the signal tech and asked what was going on.  He was a little sheepish, but told me what had happened.  Nobody got hurt, and the tech got a good reminder that you need to be careful when working around the contacts in a cabinet.
Oddities

One thing that you may see occasionally is the signal going into all-red flash because of a short yellow.  This is rare.  Most traffic signal controllers do not want to have a yellow change interval less than 3.0 seconds.  Some controllers will allow yellow change interval settings at less than 3.0 seconds, but only if the controller is programmed in one place to allow less than 3.0 seconds, and in another place to specifically program a phase to have less than 3.0 seconds.  I have been a traffic engineer for a long time, and have found exactly zero signals where I would time the signal at less than 3.0 seconds of yellow change interval.

The MMU also monitors the yellow change interval.  In the event that the yellow change interval is less than 2.7 seconds, the monitor will place the signal into all-red flash.  This can also be overwritten in the monitor settings, but like the short yellow in the controller, I have found exactly zero signals where I would override this setting in the field.

Below is an example from a traffic signal controller in a cabinet that is in a test environment.  This was forced to a short yellow as a part of testing out some features in the controller and monitor. 

If for some reason the signal actually experienced a yellow of 2.7 seconds or shorter, the signal would automatically go into all-red flash.

Reno MMU reporting a short yellow fault
Having the communications in the field allows the technician to know what has happened to the signal before leaving the desk.  This helps the technician to determine what level of equipment and expertise will be able to fix the problem.

The last example for monitors shows a known problem with the TS2 specification.  This is a minor irritant from a maintenance standpoint, but it may be a bigger deal if you are a pedestrian.


Reno MMU reporting dual indication fault
The NEMA TS2 specification requires that the monitor look at the time that the Flashing Don’t Walk (FDW) is on, and off.  The specification essentially requires that the FDW be turned on for half a second, then turned off for half a second.  The monitors generally allow for some slop in the SDLC communications frames, by allowing extension either of the on or off to 6/10th of a second.  This is because the controller is driving the outputs, and in the event that a frame is missed, the status of the indication won’t change.

Occasionally, the monitor will see the FDW on or off for 7/10th of a second.  This is seen as a problem by the monitor, and the monitor transitions the signal into all-red flash immediately.  This extra 1/10th of a second happens very rarely, but it happens.  In my experience, when a TS2-1 traffic signal is left in ped recall, this will occur about once a month, on one of the pedestrian movements that is in recall.

Video Detection Communications

Cameras fail.  Nature sometimes helps.  What appears to be a good viewing angle when you set it up may be very different at night, or in the rain.  

Cameras fail

The following three pictures show older generation cameras that have problems with the video feed images to the video processor.  When the cameras are not working properly, and feed bad information to the video processor, this defines the term “garbage in, garbage out”.

Problem camera.  Note that the picture is divided where the bottom of the screen shows the far advance, and the left side of the screen shows what should be on the right.  The video detection zones are correct, if the camera were working properly.

Problem camera.  Note how the picture is divided at the bottom of the screen.  The bottom of the screen shows what should be the far horizon of the camera.

Problem camera.  Note how the picture is divided about in the middle of the screen.  The bottom half of the picture should be above the top half.  The zones are correct, assuming that the camera is working properly
These cameras are being replaced.  The key here is, this signal was not connected to any system.  It was a lone signal, with no communications.  The only reason we knew about the problem is because a citizen got frustrated and called in that the signal wasn’t operating properly.  If this signal were connected to the system, we would have been able to look at the operation and see what was working properly and what wasn’t.
Once a week, or more frequently, I spend a chunk of time and pull up multiple signals and look at what they are doing.

In a past job, I found another unique type of problem.  The video detection was not working properly.  It didn’t take long to figure out what was causing the problem.  It probably would have taken a little less time, if I had already had my first cup of coffee before I started looking at the cameras.  In that situation, the video detection cameras were mounted on Astrobrac connections to the mastarms.  During the night, the Astrobrac straps slipped on the mastarm, and the camera swiveled from being on top of the mastarm to being on the bottom of the mastarm, hanging down instead of up.  This caused the camera to go from the normal looking at traffic approaching eastbound to the intersection, to upside down, looking at traffic departing the intersection westbound.  The stopbar detection that the camera was driving didn’t work so well.

Sometimes Nature Helps

Below is a video I took where we had a spider who created a web over the video detection camera lens.  You can see how the spider is causing false calls to the controller.


Below is a video of a poorly placed camera, but showing how the glare of headlights is causing false calls on the detectors.


The key here is to watch the detection zones for the cars traveling north (almost straight up) in the picture.  The glare from the southbound headlights does not cause false calls in the two northbound detection zones.

The two northbound detection zones are count stations.  I experimented with how to deal with the oblique angle, and headlight glare.  The remote video feed allowed me to modify the detectors and try things to see what happened in multiple weather and lighting scenarios.  

There are actually two detectors in each northbound lane of travel.  The large, visible, box is a directional detection zone.  This box is looking only for traffic heading northbound.  Any glare from a southbound vehicle’s headlights don’t cause a true condition in the Boolean logic in the detection scheme.  When a northbound vehicle causes a True condition in the box, and then the vehicle crosses an invisible line at the far north end of the box, then the detection system places a call.

Having remote communications to the video detection system allows me to test a variety of ideas in vehicle detection strategies, and observe them in various weather and lighting conditions.  Based on the glare on the wet pavement from the overhead luminaires I moved the detection zones around into the glare, out of the glare, and observed how the system operated.  Based on this, I was able to hone in on a detection strategy for this particular brand and model of video detection system that works for multiple situations.

Conclusions

These are just a few examples of how communicating to the field equipment can provide significant benefits.

The main benefit is being able to see what is going on from your desk.  In my case, I can VPN into the system and see what is going on.  Last year, I was visiting family in Idaho, and received a call that there was a problem with a signal that was under construction.  I pulled out my laptop, connected it to my MiFi card, and was on the system within 5 minutes – from Lewiston Idaho.  It took about another 3 minutes to figure out that the contractor had shifted traffic from the normal lanes to another area of the pavement that had no detection.  I modified the radar stopbar detection and in about 15 minutes total, I was back on the phone to the construction manager telling him what I had done.  He reported to me that the signal appeared to magically begin working properly.

Magically.  I like that.  Magic is how things are explained that happen mysteriously that we can not explain with other knowledge or understanding.

Saturday, February 18, 2012

Pedestrian Detection Diagnostics

One really nice feature of the new generation of controllers is the ability to assign pedestrian diagnostics.

One traditional problem with traffic signals is that a pedestrian pushbutton will become stuck, causing the signal to constantly cycle pedestrian WALK and FDW, without any pedestrians.

This is not to be confused with actuated rest in walk, or pedestrian recall.  In some cases, traffic signals are purposely set up to always bring up a WALK.  This can be very helpful in a downtown central business environment, or where there are no pedestrian pushbuttons, or where the pedestrian movements are typically heavy enough to justify constantly bringing up pedestrian movements.

At other traffic signals, like near schools, it is normal to have the traffic signal go into pedestrian recall automatically by the time of day programming during the times when pedestrians are likely to be crossing - such as during the half hour before, and half hour after the school is in operation.

Why Pedestrian Detection Diagnostics Are Important

Traffic signal controllers have specific needs in the coordination operations to make sure that under normal circumstances, the sum of the WALK, FDW, Yellow plus All Red equals the split division for that vehicle phase.  This means that under normal operations, the cycle lengths can become really long to accommodate all of the normal pedestrian timing needs.  This is getting even more problematic with the adoption of the 2009 MUTCD, and the recommended slower pedestrian speeds for the FDW timing.

Generally the corridor's timing needs are set by the largest intersection on the corridor.  All other signals have to be timed to have the same cycle length as the largest intersection, so the corridor may normally only work with a very long cycle length because of the needs of the largest intersections on the corridor.  While a huge intersection may need a 150 second cycle length to work within all of the timing parameters in the corridor,  other intersections may better work at a 90 or 100 second cycle length for most of the day.

For many years, controller manufacturers have put in "cheats" or "special features" to allow the signal to be tricked into allowing split divisions that are shorter than the sum of WALK, FDW, Yellow and All Red.  The Traconex 390 would allow these short split divisions, and give a special controller error, that allowed the controller to fail the edit checks for the split divisions, but stay in coordination.  Naztec has a "Stop In Walk" feature, that when enabled, times the split division normally until the split division timing equals 0, then the controller places a modified stop time into the program, and finishes timing the FDW, Yellow, and All-Red, then transitions to a special, aggressive, offset seeking mode to get back in coordination within a single cycle.  Other controllers have similar features, with different naming.

The special feature allows the controller to have the normal timing parameters running, but may allow a signal that wants to run on a 140 or 150 second cycle length to run at 90 second cycle length or shorter.  This will be true only if there are relatively low volumes of pedestrians.

This whole system falls apart if the signal has a stuck pedestrian pushbutton.  If the traffic signal needs 45 seconds for the sum of WALK, FDW, Yellow and All-Red, the split division is 25 seconds long for that movement and the signal is running on a short cycle length (90 seconds) then the signal will always be out of step, and in offset seeking mode.

The pedestrian diagnostics allow the signal to generate an alarm.  In the case of the signals I operate, the alarm is important enough, that the central system is constantly looking for these alarms, and when they occur, the central system automatically forwards an email to my work email to inform me that there is a problem with a stuck ped pushbutton.

Pedestrian Diagnostics by NTCIP

The NTCIP standards allow for special diagnostics to be run in the controller, similar to the vehicle detection diagnostics.  These are covered under NTCIP 1202 Section 2.3.7.3 Pedestrian Detector No Activity Parameter, Section 2.3.7.4 Pedestrian Detector Maximum Presence Parameter and Section 2.3.7.5 Pedestrian Detector Erratic Counts Parameter.  The reporting is covered under Section 2.3.7.6 Pedestrian Detector Alarms.

The three types of pedestrian detection parameters are defined as follows:
  • "Pedestrian Detector No Activity diagnostic Parameter in minutes (0–255 min.) . If an active detector does not exhibit an actuation in the specified period, it is considered a fault by the diagnostics and the detector is classified as Failed. A value of 0 for this object shall disable this diagnostic for this detector."
  • "Pedestrian Detector Maximum Presence diagnostic Parameter in minutes (0-255 min.). If an active detector exhibits continuous detection for too long a period, it is considered a fault by the diagnostics and the detector is classified as Failed. A value of 0 for this object shall disable this diagnostic for this detector."
  • "Pedestrian Detector Erratic Counts diagnostic Parameter in counts/minute (0-255 cpm). If an active detector exhibits excessive actuations, it is considered a fault by the diagnostics and the detector is classified as Failed. A value of 0 for this object shall disable this diagnostic for this detector."
Recommended Settings

An important thing to understand about the pedestrian diagnostic parameters is that if you set any values, and the thresholds are met, the controller will place the signal in pedestrian recall until the problem goes away.

The Pedestrian Detector No Activity diagnostic Parameter is one that I generally don't touch.  After I explained the operation of pedestrian diagnostics to a friend who worked for an agency in Alaska, he put them into the signal.  Then all of the signals went into pedestrian recall late at night.  The problem solution was really tricky to figure out... Another person got the call out in the middle of the night, knew nothing about the special controller settings, and was completely baffled about why all of the signals were in pedestrian recall until a pedestrian pushbutton was pushed, then it went away...  They went to the next signal, pushed the buttons, and the problem went away.  Went to the third signal, pushed the buttons and the problem went away, but by that time, the detection error had reset itself (no other pedestrian buttons pushed at the first signal because it was in the middle of the night), so the first signal went back into pedestrian recall.

You can imagine the conversation in the signal shop the next morning.  It probably started with "What the..." and went downhill from there.

In general, I only set the Pedestrian Detector Maximum Presence diagnostic Parameter.

Generally, I set the max presence to 3 minutes.

The thinking is that somebody may push in a button, but not likely for more than 3 minutes.

I generally don't set the erratic counts.  I need to see how that works, where you have a button where the pedestrian pushes the button over and over again.


Other Pedestrian Detector NTCIP Stuff

The error states of this are defined as follows:

     Bit      Definition
     0         No Activity Fault: This detector has been flagged as non-operational due to lower than expected activity by the CU detector diagnostic.
     1         Max Presence Fault: This detector has been flagged as non-operational due to a presence indicator that exceeded the maximum expected time by the
               CU detector diagnostic.
     2        Erratic Output Fault: This detector has been flagged as non-operational due to erratic outputs (excessive counts) by the CU detector diagnostic.
     3        Communications Fault: Communications to the device (if present) have failed.
     4        Configuration Fault: Detector is assigned but is not supported.
     5-6     Reserved.
     7        Other Fault: The detector has failed due to some other cause.
     Once set a bit shall maintain its state as long as the condition exists. The bit shall clear when the condition no longer exists."


NTCIP Detection Settings

NTCIP Standards

The 1202 NTCIP standards allow for additional information to be provided by the detectors to the controller.  This allows the controller to display detector errors in addition to logging failed detection.

Under the 1202 section 2.3.2.13 Vehicle Detector Reported Alarms, the following as a mandatory data type.

     "This object shall return detector device reported alarms (via some communications mechanism). Inductive Loop Detector Alarms are indicated as follows:
     Bit     Definition
     0       Other
     1       Watchdog Fault: This detector has been flagged as non-operational due to a watchdog error.
     2       Open Loop Fault: This detector has been flagged as non-operational due to an open loop (broken wire).
     3       Shorted Loop Fault: This detector has been flagged as non-operational due to a shorted loop wire.
     4       Excessive Change Fault: This detector has been flagged as non-operational due to an inductance change that exceeded expected values.
     5-7    Reserved
    Once set a bit shall maintain its state as long as the condition exists. The bit shall clear when the condition no longer exists."

This may be a mandatory data type, but it only works if the communications between the controller and the loop amplifier is a data stream, instead of a wire with an ON / OFF switch.

TS2'ish Standards Within the NTCIP Requirements

Under the 1202 section 2.3.5.4.2 Occupancy data standard,  the detector provides the following information to the controller.

     Range      Meaning
     0-200       Detector Occupancy in 0.5% Increments
     201-209   Reserved
     210           Max Presence Fault
     211           No Activity Fault
     212           Open loop Fault
     213           Shorted loop Fault
     214           Excessive Change Fault
     215           Reserved
     216          Watchdog Fault
     217          Erratic Output Fault
     218-255   Reserved

The table above is essentially an continuation of the TS2 standards. 

This really only works if the controller has the ability to transmit not only the fact that the detector channel is on, or off, but provides a bit stream of data to the controller.  This can be done with TS2 detection, but not with TS1 or standard CalTrans 332 data.

By using the TS1 or 332 standard for detection, the detector provides a contact closure on a wire to an input on the controller.  This is either on, or off, not a system of transmitting data.

TS2 Detection Provides Better Intelligence 

With the TS2 standard, the serial communications transmits data streams between the equipment, which allows for more than an on / off switch, like the TS1 or 332 data.  The TS2 data stream is more robust, allowing for one set of bits to say one of the following messages
  • "I was off, and I am still off"
  • "I was off, and I am now on"
  • "I was on and I am not off"
  • "I was on, and I am still on"
along with a lot of other information, including the bits to define the data range from 0 to 255.

This is helpful for a bunch of reasons.  When any controller is talking to a central system, the controller and central system can be set up to log the detector failure status - based on whatever detection diagnostic parameters are programmed into the controller.  The TS2 controller can not only provide the fact that the diagnostic has failed, but it can also tell you what failed (see codes 210 to 217 from the list above).

This means that with a TS2 controller that is reporting back to a central system, the signal can provide actionable information to the engineer and technician to determine what the problems are, in addition to the fact that there is a problem.

It is a straightforward prospect to determine what has gone wrong, and help the fixing of a problem...  Is it a cut wire, or is it a splice?  Knowing in advance what happened to the loop can be the difference between going out to fix the problem, and then going back to get the proper equipment, or knowing that you need to schedule a loop cutter.  Since this data can be recorded in the central system, the user can run reports and determine what should be done system wide, and most importantly, find a bunch of loops that need to be replaced quickly, and efficiently - but only if the controller gets the coded information.  This is why we are looking at putting TS2 detection into 332 cabinets.

Detector Reset

Another TS2 / NTCIP standard requires the remote resetting of detection amplifiers.  Some controllers do this.  Many don't, even when they say they are "NTCIP" or "TS2".  I asked one controller manufacturer (who will remain nameless) why their controller and central system did not allow for remote resetting of detection amplifiers, even though they stated that they were fully NTCIP and TS2 compliant.  The response was "Nobody ever asked us about that".

From NTCIP 1202 section 2.3.2.14, Vehicle Detector Reset, there is a mandatory requirement that the detectors can:

"This object when set to TRUE (non-zero) shall cause the CU to command the associated detector to reset. This object shall automatically return to FALSE (zero) after the CU has issued the reset command. NOTE: this may affect other detector (detector channels) that are physically attached to a common reset line."


Other Reasons Why Data Is Better Than On / Off Switches

There is another reason why the TS2 detection is helpful.  Most NTCIP based controllers keep a log of the failures, including the detection failures.  One of the things that happens quite often, is an engineer or technician opens the door up, and they want to clear a fault by pulling the detector card, and resetting it...  Hopefully, the fault goes away.  What if you want to know what the reason was for the fault, after you cleared the card?

Since this information is kept in the controller, in a log, the engineer or technician can navigate through the controller menu to get to the logs, and see what the problem was.  In my case, we use Naztec Apogee software, so the code is reported as a hexadecimal code, not an easy number.  That is why I have a cheat sheet with me...

Friday, February 17, 2012

Controller Detection Diagnostics


Improving your controller operations

A traditional problem with vehicle detection is when vehicle detection fails, causing constant calls into the traffic signal controller, causing the signal to hold for long periods of time for phases without any actual vehicles on the detection for those phases.

One underused feature that can reduce the effect of, and provide automatic reporting of these problems on many traffic signal controllers are vehicle and pedestrian detection diagnostics. Various versions of detection diagnostics have been on traffic signal controllers for many years.  Detection diagnostics are now defined as a standard requirement under NTCIP section 1202.

Essentially, there are several diagnostic parameters that can be assigned to each detection input, and each pedestrian input to the controller. Depending on the function of those parameters the controller can modify the operation of the detection input automatically, and forward alarms to a central system when the problem occurs.

So why do this?
Stuff happens.  Simple as that.

Detectors fail.  Utilities cut loops.  People park inside detection zones.  Sometimes other things happen that can not be engineered around.  In the attached video, a spider has build a web in front of the video detection camera.


Some agencies now use IMSA 51-3 or 51-7 loop wire.  Many agencies use single jacketed loop wire.  Why is this important?  Pavement is flexible.  It may not seem so, but as vehicle drive over the pavement, the weight of the wheels pushes the pavement around.  This minor nudging happens hundreds of thousands of times per year, and the loop may be in the pavement for several decades.  A single jacketed wire will directly put the pavement stress onto the loop wire.  Eventually, the loop wire's jacketing will crack, and allow water to migrate into the crack, onto the copper wire.  The copper wire will ultimately corrode, but in the near term, the water will short out the loop causing intermittent problems that occur only after rain - until the wire is corroded to the point where it will no longer conduct the electricity needed for the loop amplifier to function.


Using the IMSA 51-3 or 51-7 wire improves the loop life.  These wire types are double jacketed, with the inner jacket being cross linked polyethelene (XLPE).  The wire manufacturer shoots X-rays at the polyethelene jacket as it it comes out of the extruder.  The XLPE is exceptionally tough.  IMSA 51-3 wire has a second jacket, with no air core.  IMSA 51-7 has a second jacket with an air core.  We use 51-7 to further reduce the stress on the wire.

Additionally, the loop wire is spliced to home run cable in a junction box.  The junction box may be dry, it may be completely submerged.  The splice is a physical connection of two different wires within an enclosure.  Water migrates into the splices, causing corrosion and failure.

Other types of detection have problems too.  Video fails.    In the video to the right, snow is causing a failure of the video detection system.


Radar fails.  

The traffic signal controller is designed to act a specific way when it sees a problem with the vehicle detection.  When the detector has a problem, the signal will automatically call the specific vehicle movement that the detector was assigned to, and hold that call for a maximum amount of time.  That is why sometimes, you drive up on a signal on the main street in the middle of the night, and the signal is holding for the side street for 40, 50, 60 seconds or longer.  It is likely that one of the vehicle detectors has failed on the side street, and the traffic signal is screaming for attention.

NTCIP Discussion

For vehicle detection, NTCIP defines three mandatory parameters which include No Activity, Maximum Presence and Erratic Counts. NTCIP also defines an “optional” detector fail time parameter. Since this feature is optional, your controller may, or may not include this. Specific controller manufacturer may have additional features. Specific controller manufacturers may also have expanded functionality on the basic NTCIP parameters that will help provide further improved operations.
  • No Activity – This parameter allows the controller to monitor each detection input for lack of detection input, from 0 to 255 seconds. This parameter can be useful in finding if a specific detection input has a lack of any calls. This parameter can be tricky to use, as if the detection on an approach actually has no calls, using this feature may falsely report problems.
  • Maximum Presence - This parameter allows the controller to monitor if a detector has been constantly active for between 0 and 255 seconds. This parameter is very useful in identifying vehicle detection that locks on, because of problematic video detection, or bad loops, or where you have cars that may park on detectors.
  • Erratic Counts – This parameter allows the controller to monitor if the detector has been receiving excessive actuations, ranging from 0 to 255 counts per minute. This parameter allows the controller to monitor if a detector is chattering the call into the controller input. This parameter is very useful in finding where the vehicle detention is erratically chattering the input into the controller.
  • Detector Fail Time – This parameter is an optional parameter, which allows the controller to modify the operation of the detector that has failed any of the three detector parameters. If any of the detector diagnostics failed, the controller will place a call on the assigned phase during all non-green intervals, and then hold that call for the user specified time under this entry, from 0 to 255 seconds.
In general, when I am setting up detection diagnostics in a traffic signal controller, I use the following general parameters as a starting point.

Parameter Stopbar
(no standing queue expected)
Stopbar
(standing queue expected)
Advanced System Detectors


No Activity 0 minutes 0 minutes 0 minutes 0 minutes
Maximum Presence 3 minutes 5 minutes 3 minutes 2 minutes
Erratic Counts 90 cpm 90 cpm 120 cpm 90 cpm
Detector Fail Time 10 seconds (side street)
15 seconds (main street)
10 seconds (side street)
20 seconds (main street)
10 seconds (side street)
20 seconds (main street)
0 seconds

The parameters above are monitored, and adjusted to fit the needs of the intersection.

Detection diagnostic parameters are most useful when each unique physical vehicle detector has a unique detection channel in the controller. There is also benefit where groups of physical vehicle detectors are ganged up in series / parallel to a vehicle detection input on the controller.

Some controllers allow different detector patterns by time of day.  Many of these controllers allow alternate detection diagnostics by time of day.  This may allow the signal to test for lack of calls on any vehicle detection during the busy times.  It would not make sense to have no calls on a main street detector during the peak hour, but it may make sense that at 2:00 AM, it may be 5 minutes or more between vehicle calls.

Central System Communications

This really only helps if you ask the controllers what they are doing.  If there is no communications to the controller, there is no way to know if the detection is failing or working properly, unless you drive out to the signal, and stand and watch the detectors and controller.

Wherever possible, the controller should be connected to communications (Ethernet (fiber optic, VDSL, radio, CDMA modem) or telephone dial up, to allow the signal to report back what is going right, and what is going wrong.  This also requires that the controller sends alarms to a central system.

If the system is reporting something wrong, crews can be dispatched to fix problems.